Part 1: Data Management Fundamentals
Independently Accessing an API and Creating your Own Plots
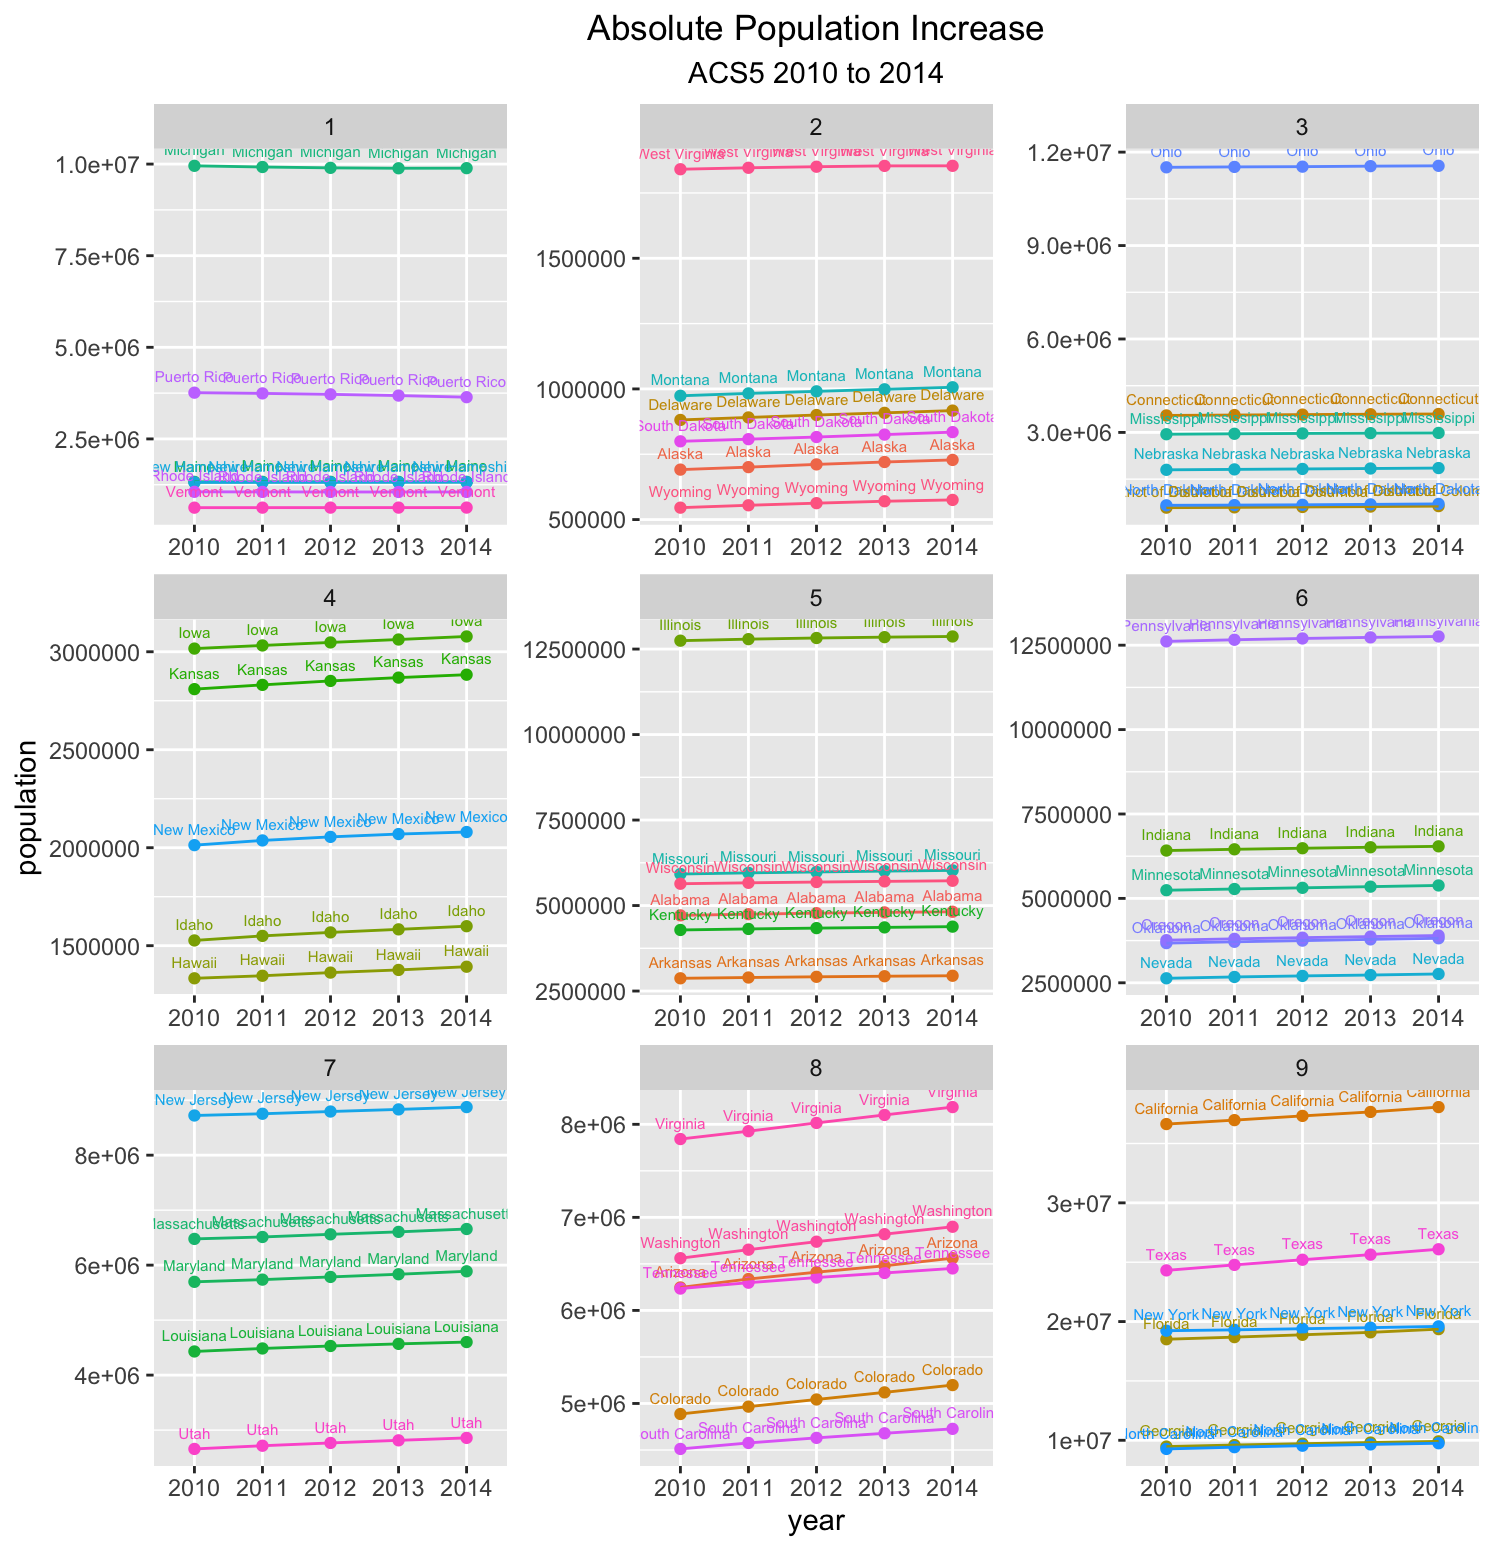
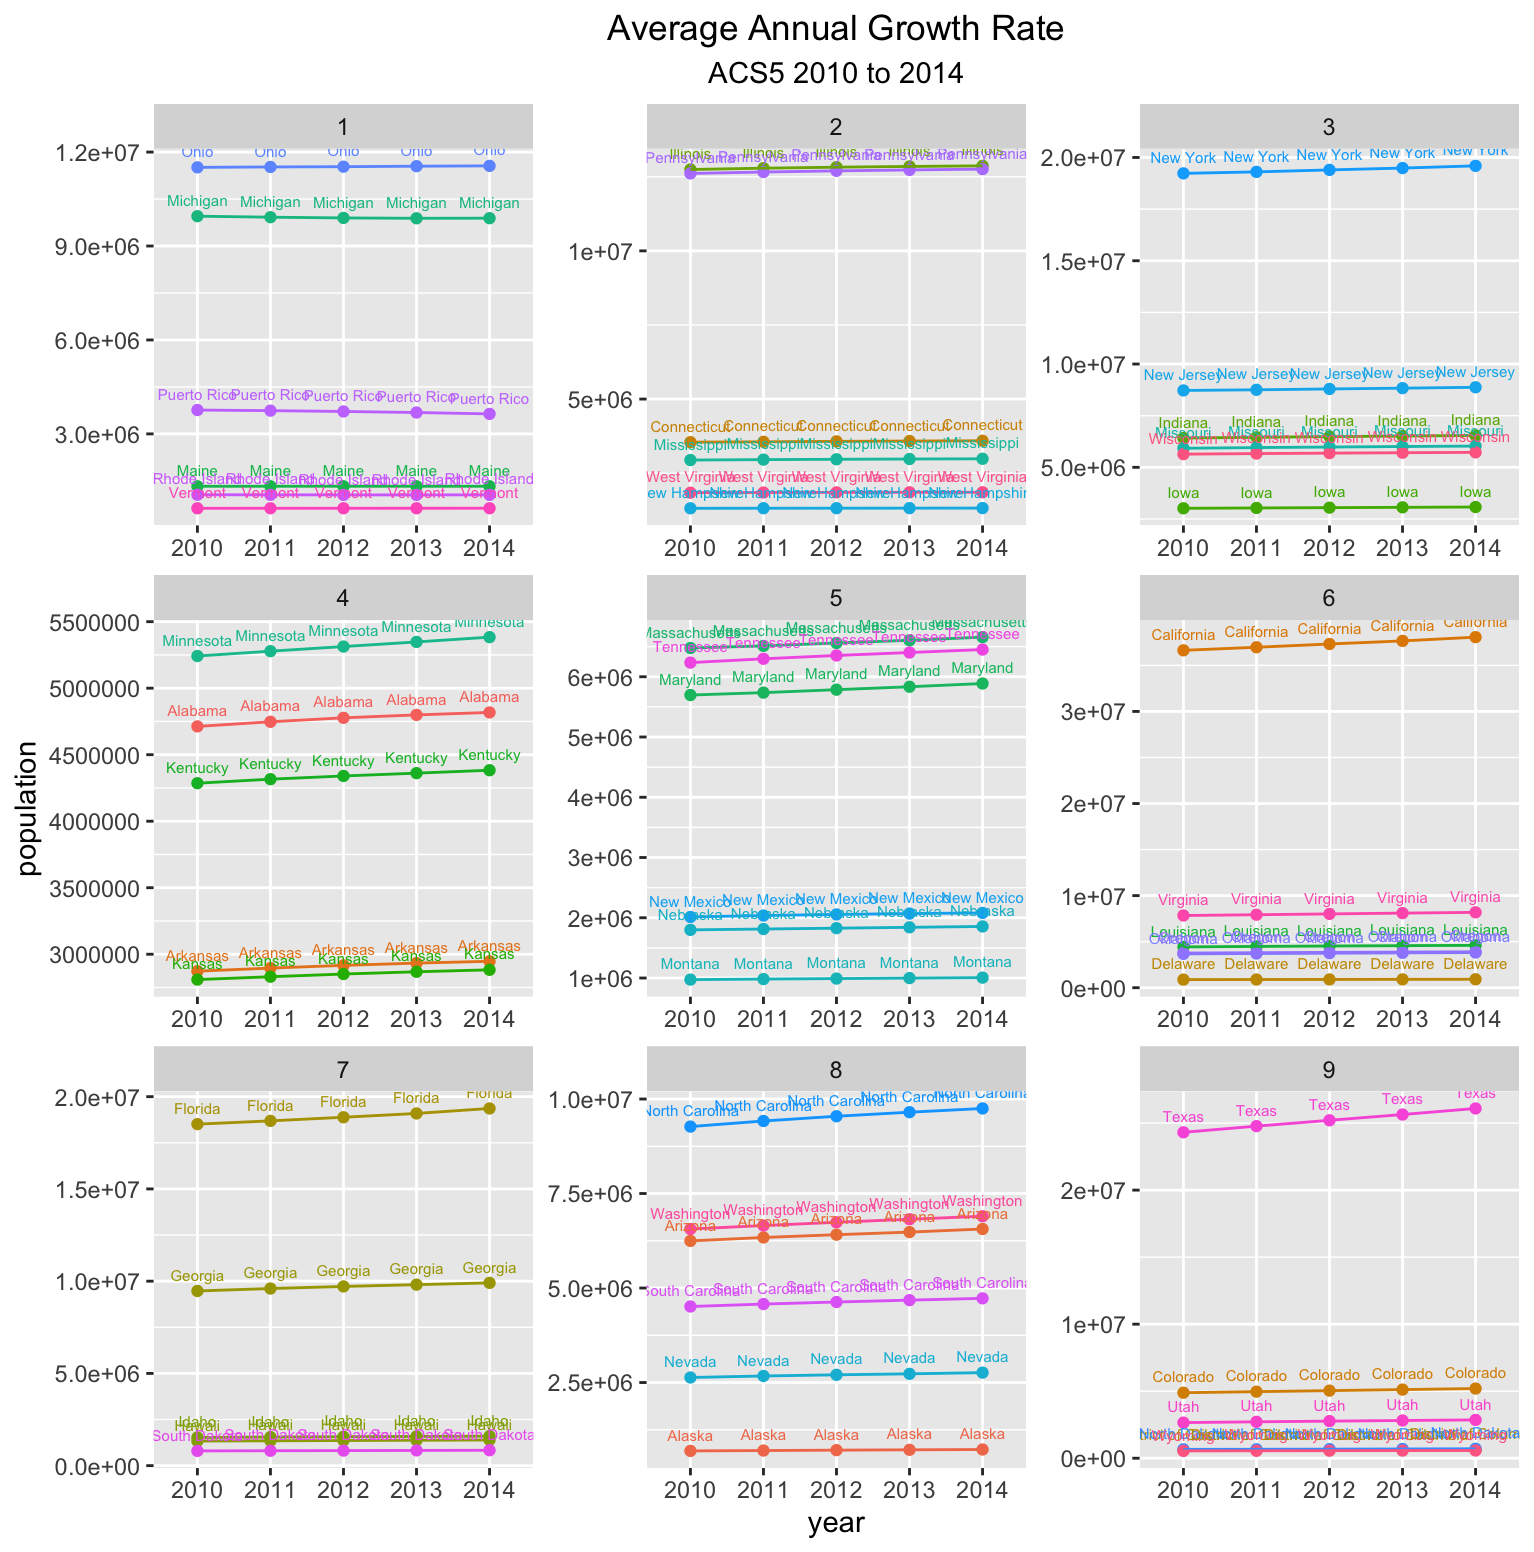
Part 1 of this project required me to obtain data from a remote server using an API. In this case, the data was American Community Surveys (ACS) from the Federal Census Bureau. I created a data frame using 5 years of data (2010-2014), containing the populations for the 52 primary U.S. subdivisions. With this data, I calculated the population increase and average growth rate for each subdivision across 5 years and plotted them using ggplot, faceting them into 9 quantiles.
Part 2: Introduction to Data Science
Using the Stock Market to Describe, Analyze, and Predict
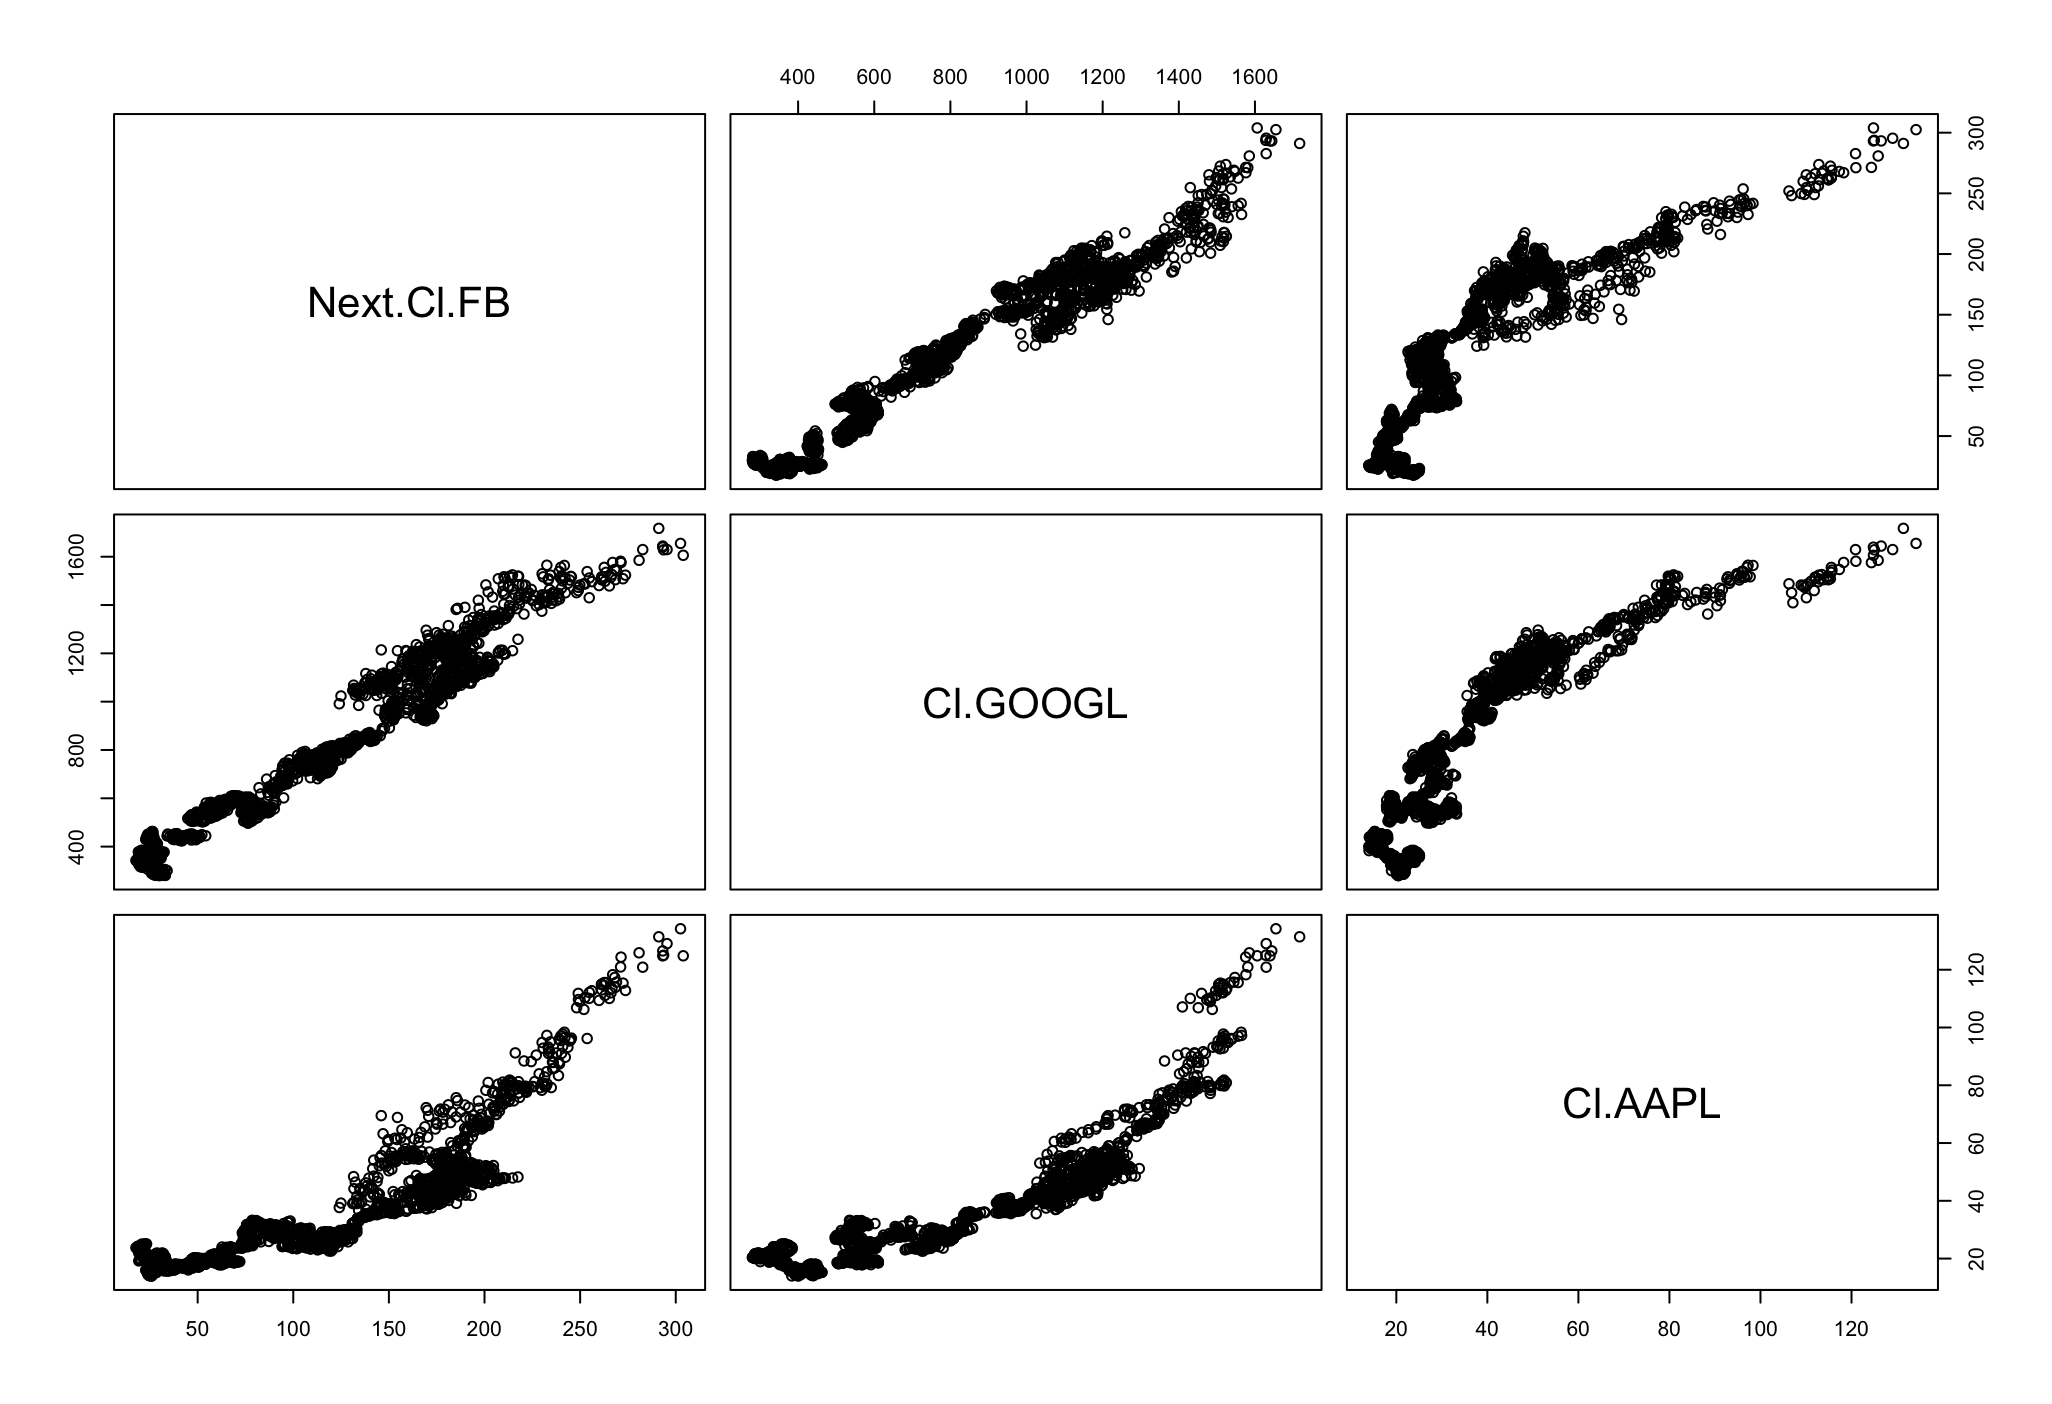
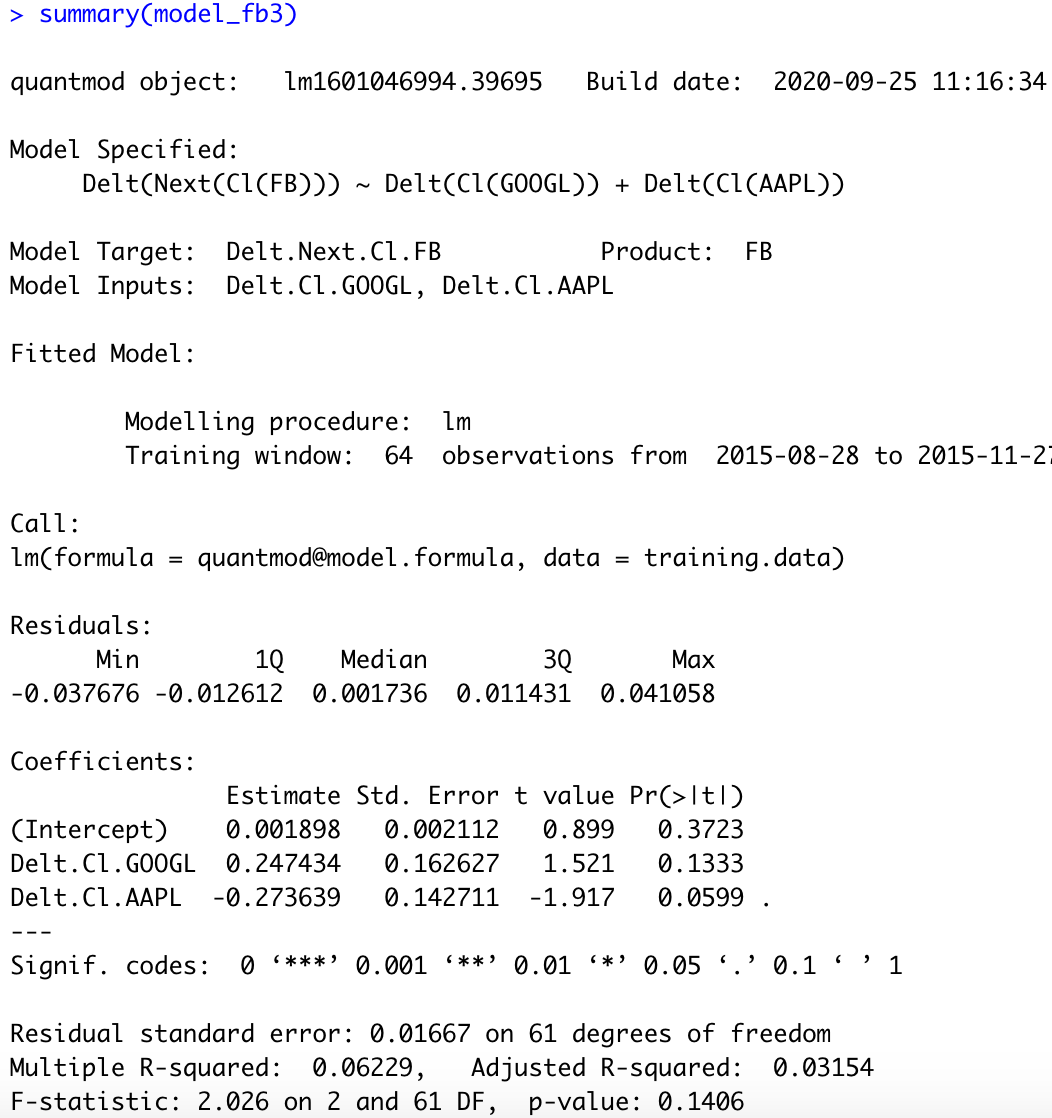
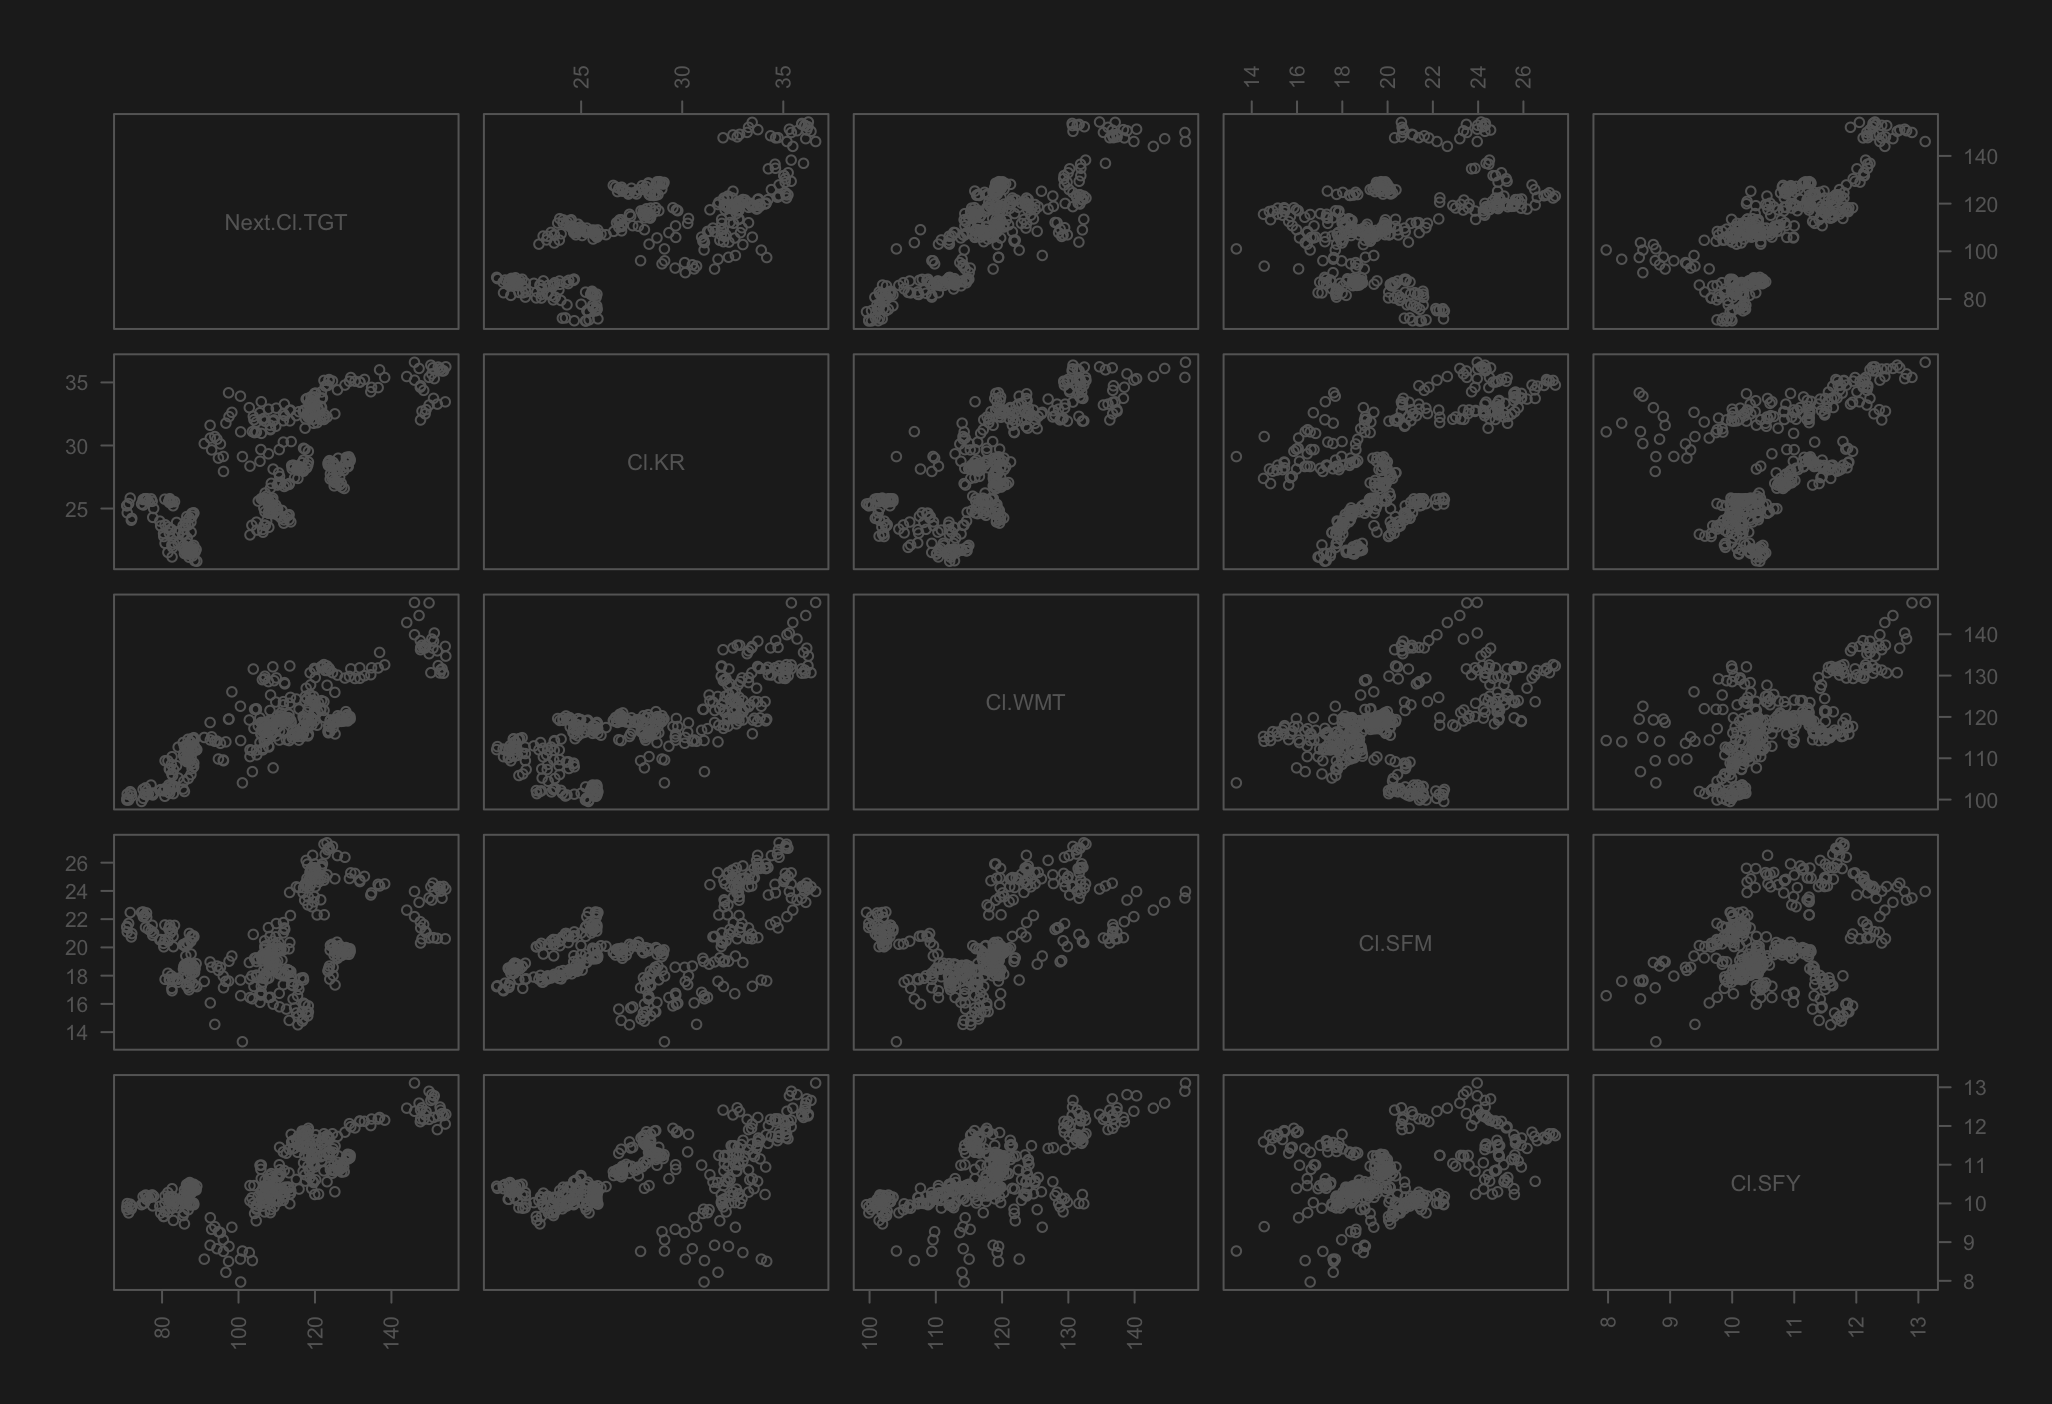
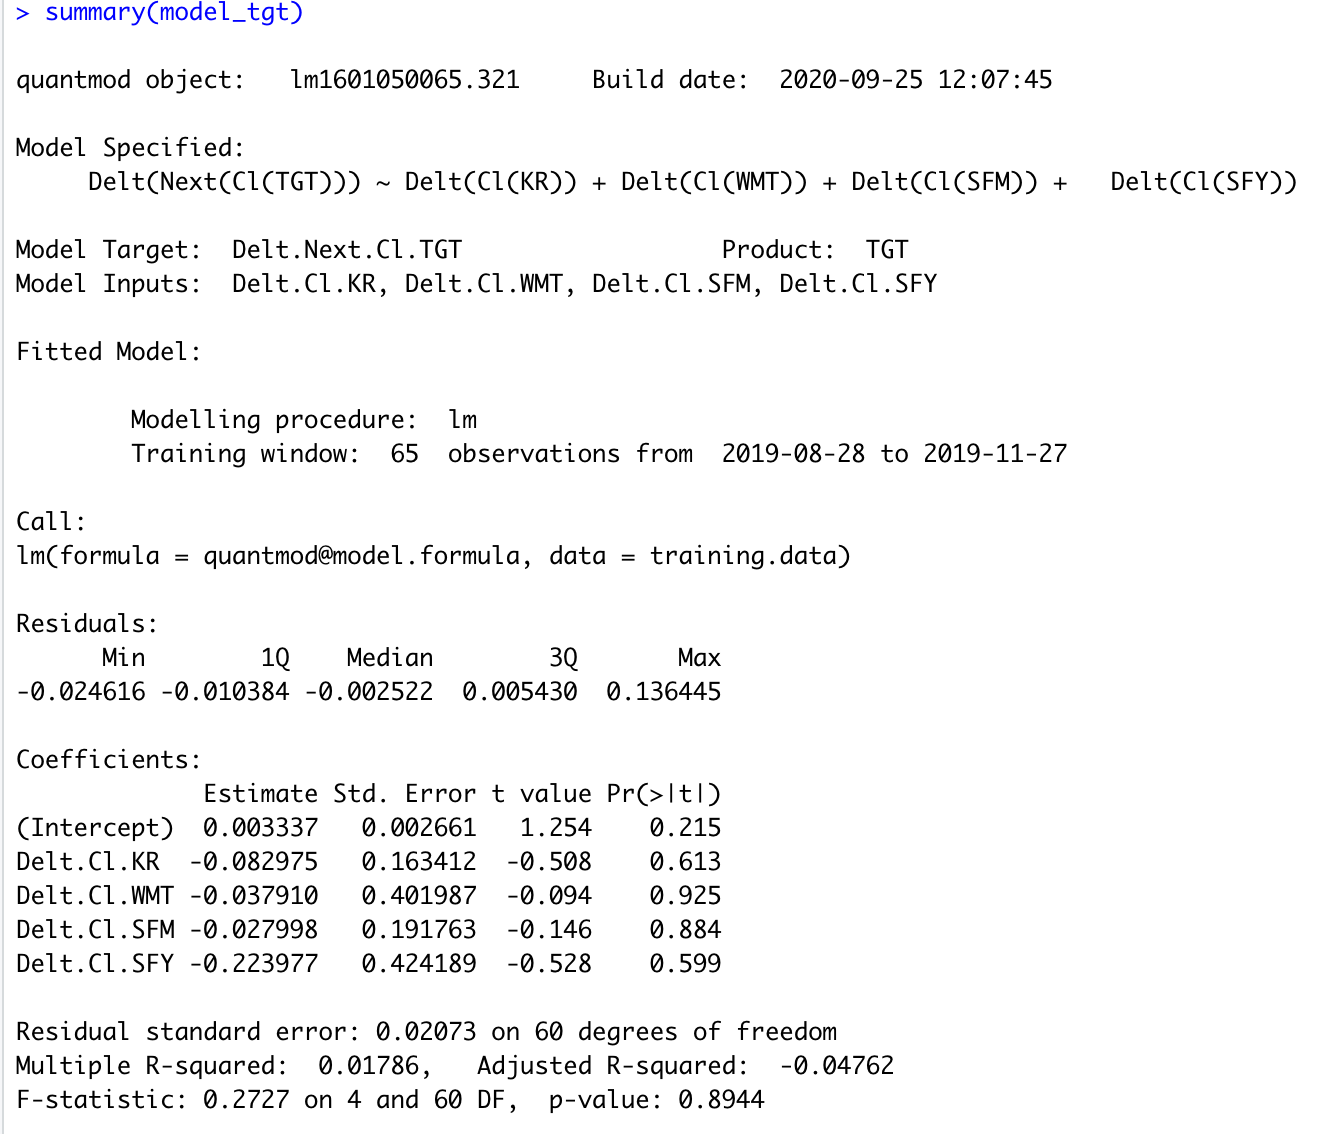
Part 2 of this project required me to obtain stock data using the quantmod package and analyze the data for patterns and predictors. I ran the code first using the companies given in the example: Apple, Facebook, and Google. Then I used my own choice of similar companies to produce plots and a statistical model: Target, Kroger, Walmart, Sprouts, and Safeway. I specified a model to predict Target’s future stock price (response variable) using the current stock price of the other companies (predictor variables) using stock data from August to November of 2019.
Using given example stocks
Using my own selected stocks
Part 3: Introduction to Data Science
Using tidyquant Analyze Stock Performance
Part 3 of the project involved using the tidyquant package to hypothetically manage a portfolio of stocks. I used the same stocks as the previous part and allocated $10,000 across my portfolio to optimize my profit. The graphs below show the portfolio returns and the growth over a two year period.